Since I first played around with my first ADC on the BBC Micro in the early ’90s, I’ve always had a bit of a thing for data logging of one sort or another – when building data visualisations or just playing around with datasets it’s usually more fun working with data you’ve collected yourself.
So a few years ago I bought a little weather station to stick up in the garden, mostly for my wife, who’s the gardener, to keep an eye on the temperature, wind, humidity, etc. It has a remote sensor array in the garden running off a few AA batteries and transmitting wirelessly to a base station, with a display, which we keep in the kitchen. The base station also displays indoor temperature & pressure.
I discovered, more recently, that the sensor array transmits its data on 433MHz which is a license-free band for use by low power devices. At around the same time, I also discovered the cheap RTL-SDR repurposed DVB-T USB stick and eventually found my way over to the very convenient rtl_433 project.
Eventually, I wanted to try and build a datalogger for the weather station, but rather than periodically plugging the base station into something to offload the data it already captures, or leave something ugly plugged into the base station in the kitchen, I figured I’d configure a spare raspberry pi with rtl_433 and run it somewhere out of the way, so I duly went ahead and did that. It works really well and I’ve added a basic web UI which mimics the original base station display and combines it with data from elsewhere (like moon phases) and my intention is eventually to combine all sorts of other stuff like APT weather satellite imagery and maybe even sunspot activity for my other radio-based interests.
Even though the capture has been running permanently for at least a year now I’ve never really gone back to look at the data being logged, which was one of my original plans (temperature trend plots). Having a poke around the data this morning reminded me that actually there are lots of other things which broadcast on the same frequency and I wanted to share them here.
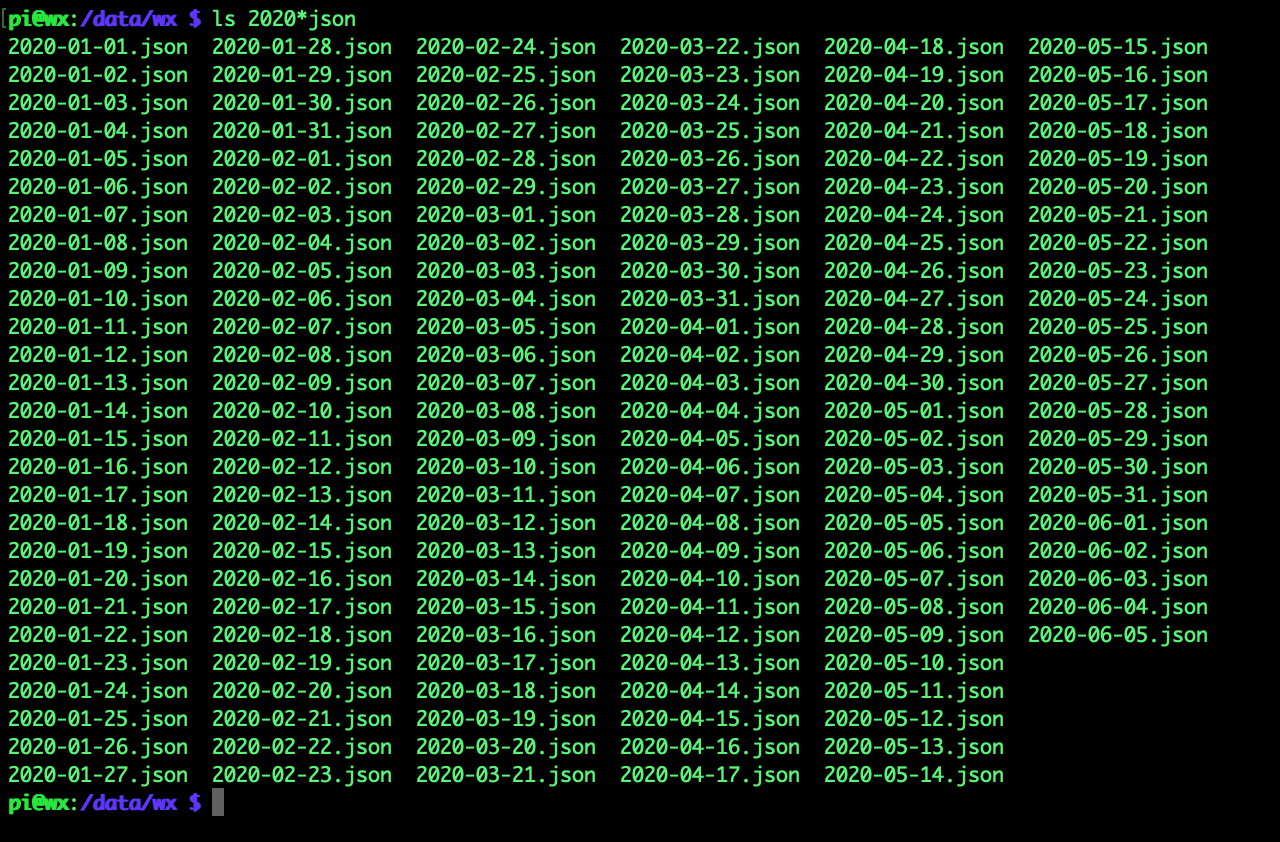
My logger logs to JSON format files by date, which makes it quite easy to munge the data with jq. The folder looks something like this:
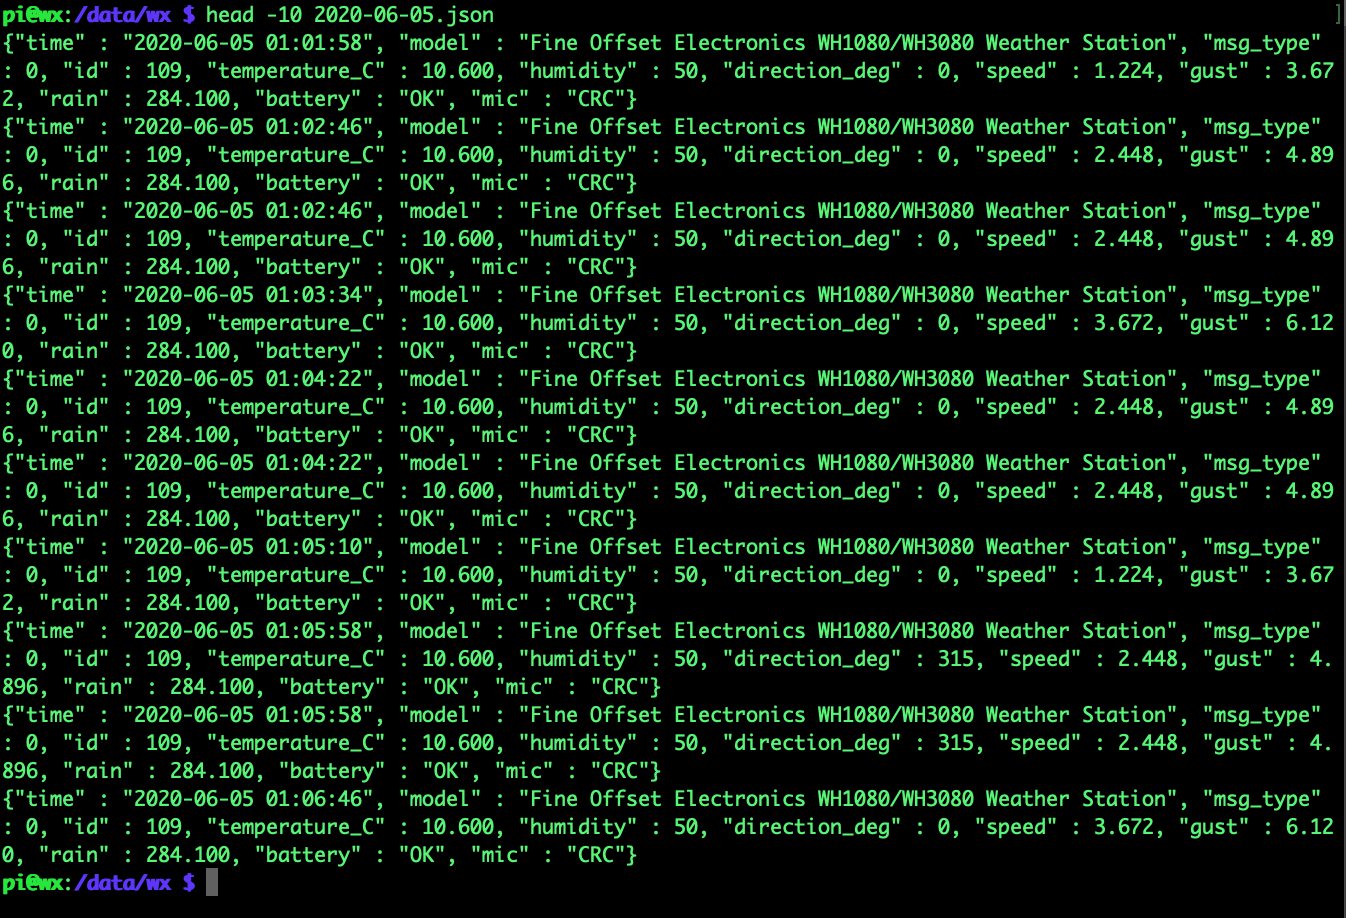
The contents of the files is nicely formatted and mostly looks like this
Meaning I can batter my little raspberry pi and run a bit of jq over all the files:
cat 2020*json | \
jq --slurp 'group_by(.model)|map({model:.[0].model,count:length})'
That is to say: dump all of the 2020 JSON files, slurp them all into a big array in jq, group them into separate arrays by the “model” field, then transform those multiple arrays into just the name from the first element and a count of how many elements were in each array. Neat!
My poor little Pi didn’t like it very much. Each of those files has up to about 3000 records in and slurping the whole lot into memory leads to sad times.
Ok, so running one of the files alone ends up with a clean result
pi@wx:/data/wx $ jq --slurp 'group_by(.model)|map({model:.[0].model,count:length})' 2020-06-05.json
[
 {
  "model": "Ambient Weather F007TH Thermo-Hygrometer",
  "count": 1
 },
 {
  "model": "Citroen",
  "count": 1
 },
 {
  "model": "Elro-DB286A",
  "count": 2
 },
 {
  "model": "Fine Offset Electronics WH1080/WH3080 Weather Station",
  "count": 1956
 },
 {
  "model": "Ford",
  "count": 3
 },
 {
  "model": "Oregon Scientific SL109H",
  "count": 1
 },
 {
  "model": "Renault",
  "count": 3
 },
 {
  "model": "Schrader Electronics EG53MA4",
  "count": 1
 },
 {
  "model": "Smoke detector GS 558",
  "count": 2
 }
]
So mostly weather station data from (presumably!) my WH1080/WH3080 sensor array. The Oregon Scientific SL109H also looks like a weather station – I didn’t think my base station transmitted indoor temps, but I could be mistaken – will have to have a look. Someone else is also running a F007TH Hygrometer doing something similar, too. Citroen, Ford, Renault and Schrader are all tyre pressure sensors of neighbours and/or passing traffic. The Elro-DB286A is a neighbours wireless doorbell… that could be fun spoofing, and the GS558 is obviously a smoke detector, a lot less fun spoofing.
So, I can build tallies for each dated file like so:
for i in 2020*json; do
  cat $i \
  | jq --slurp 'group_by(.model)|map({model:.[0].model,count:length})|.[]';
done > /tmp/2020-tallies.json
Then sum the tallies like so:
cat /tmp/2020-tallies.json | \
jq -s '.|group_by(.model)|map({model:.[0].model,sum:map(.count)|add})'
The data includes a few more devices now, as one might expect. The frequency list looks like this (alphabetical rather than by frequency):
[
 {
  "model": "Acurite 609TXC Sensor",
  "sum": 1
 },
 {
  "model": "Acurite 986 Sensor",
  "sum": 4
 },
 {
  "model": "Akhan 100F14 remote keyless entry",
  "sum": 9
 },
 {
  "model": "Ambient Weather F007TH Thermo-Hygrometer",
  "sum": 13
 },
 {
  "model": "Cardin S466",
  "sum": 12
 },
 {
  "model": "Citroen",
  "sum": 1450
 },
 {
  "model": "Efergy e2 CT",
  "sum": 35
 },
 {
  "model": "Elro-DB286A",
  "sum": 134
 },
 {
  "model": "Fine Offset Electronics WH1080/WH3080 Weather Station",
  "sum": 375066
 },
 {
  "model": "Ford",
  "sum": 4979
 },
 {
  "model": "Ford Car Remote",
  "sum": 31
 },
 {
  "model": "Generic Remote",
  "sum": 28
 },
 {
  "model": "Honda Remote",
  "sum": 55
 },
 {
  "model": "Interlogix",
  "sum": 26
 },
 {
  "model": "LaCrosse TX141-Bv2 sensor",
  "sum": 47
 },
 {
  "model": "Oregon Scientific SL109H",
  "sum": 229
 },
 {
  "model": "Renault",
  "sum": 2334
 },
 {
  "model": "Schrader",
  "sum": 1566
 },
 {
  "model": "Schrader Electronics EG53MA4",
  "sum": 435
 },
 {
  "model": "Smoke detector GS 558",
  "sum": 155
 },
 {
  "model": "Springfield Temperature & Moisture",
  "sum": 2
 },
 {
  "model": "Thermopro TP11 Thermometer",
  "sum": 1
 },
 {
  "model": "Toyota",
  "sum": 474
 },
 {
  "model": "Waveman Switch Transmitter",
  "sum": 2
 }
]
Or like this as CSV:
pi@wx:/data/wx $ cat /tmp/2020-tallies.json | jq -rs '.|group_by(.model)|map({model:.[0].model,sum:map(.count)|add})|.[]|[.model,.sum]|@csv'
"Acurite 609TXC Sensor",1
"Acurite 986 Sensor",4
"Akhan 100F14 remote keyless entry",9
"Ambient Weather F007TH Thermo-Hygrometer",13
"Cardin S466",12
"Citroen",1450
"Efergy e2 CT",35
"Elro-DB286A",134
"Fine Offset Electronics WH1080/WH3080 Weather Station",375066
"Ford",4979
"Ford Car Remote",31
"Generic Remote",28
"Honda Remote",55
"Interlogix",26
"LaCrosse TX141-Bv2 sensor",47
"Oregon Scientific SL109H",229
"Renault",2334
"Schrader",1566
"Schrader Electronics EG53MA4",435
"Smoke detector GS 558",155
"Springfield Temperature & Moisture",2
"Thermopro TP11 Thermometer",1
"Toyota",474
"Waveman Switch Transmitter",2
Removing my weather station from the set, as it dwarfs everything else, the results look like this:
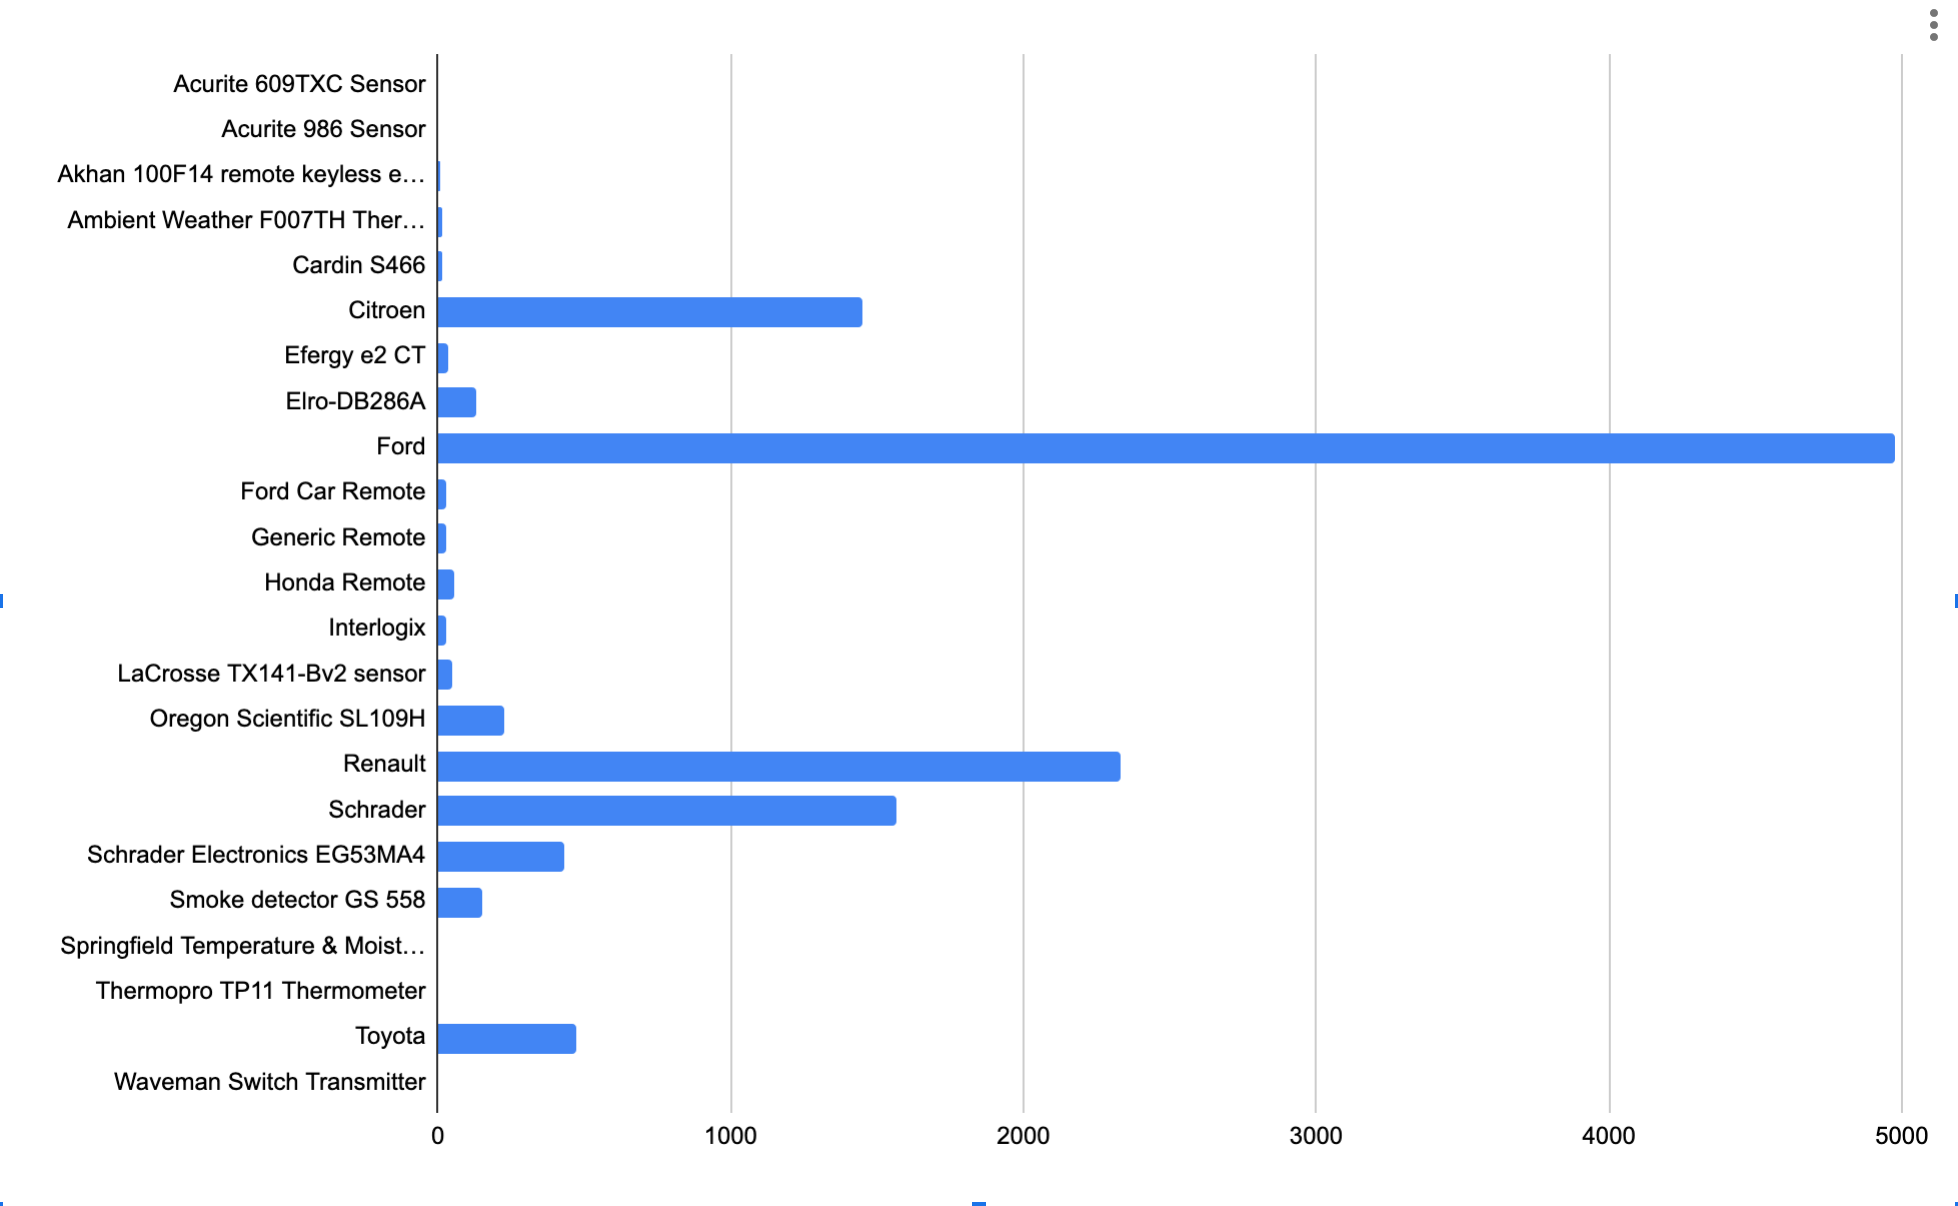
So aside from Ford having the most cars with tyre pressure monitors, it looks like there are a few other interesting devices to explore. Those car remotes don’t feel very secure to me, that’s for sure.
I’ve only just scratched the surface here, so if you’ve found anything interesting yourself with rtl_433, or want me to dig a bit deeper into some of the data I’ve captured here please let me know in the comments.