I’ve been applying to jobs for a few months now and I’m beginning to wonder whether AI has eaten them all. Not only the jobs but the companies I’m applying to as well. Being reasonably-well organised, I started keeping track of my applications and their states from day one. I should have used the CRM I wrote back in the 2000s but I needed more immediacy in the data entry and access (todo: feature request) so I used Google Sheets.
It became clear to me very quickly that a large proportion of these roles had something wrong with them – either basic details missing, usually no salary specified, or simply nobody on the other end of the application. I’m used to HR teams and processes being pretty crap most of the time, but this seems to be something else – no responses to direct applications, no responses to agency applications, duplicate vacancies clearly being reposted on LinkedIn within days of the original – what gives?
My go-to in these days of modern AI-enlightenment is that the role, the company, the candidate tracking system, or all of the above have probably been eaten by AI, but to what end? Simply harvesting details seems like a glorious waste of time, and from my many years of being on the receiving end of thousands of applications (and hiring lots of developers), the quality of a reasonable chunk of those rejected applications wouldn’t be good enough to use for model training unless you’re demonstrating what not to do.
Anyway, as my list of failed applications nears one hundred (since Feb 2025), I find myself with a reasonably complete, therefore reasonably decent quality dataset, albeit one with questionable utility, to screw about with in D3. Go play with it here because wordpress is a bit naff at embedding nice-sized iframes.
I’ve been excited by e-ink displays for a long while. I leapt on the original, gorgeous reMarkable tablet as soon as it came out and have been a regular user and advocate ever since. I would dearly love to have one or two of theseenormous 42″ e-ink art poster displays on the wall, but that’s for another day.
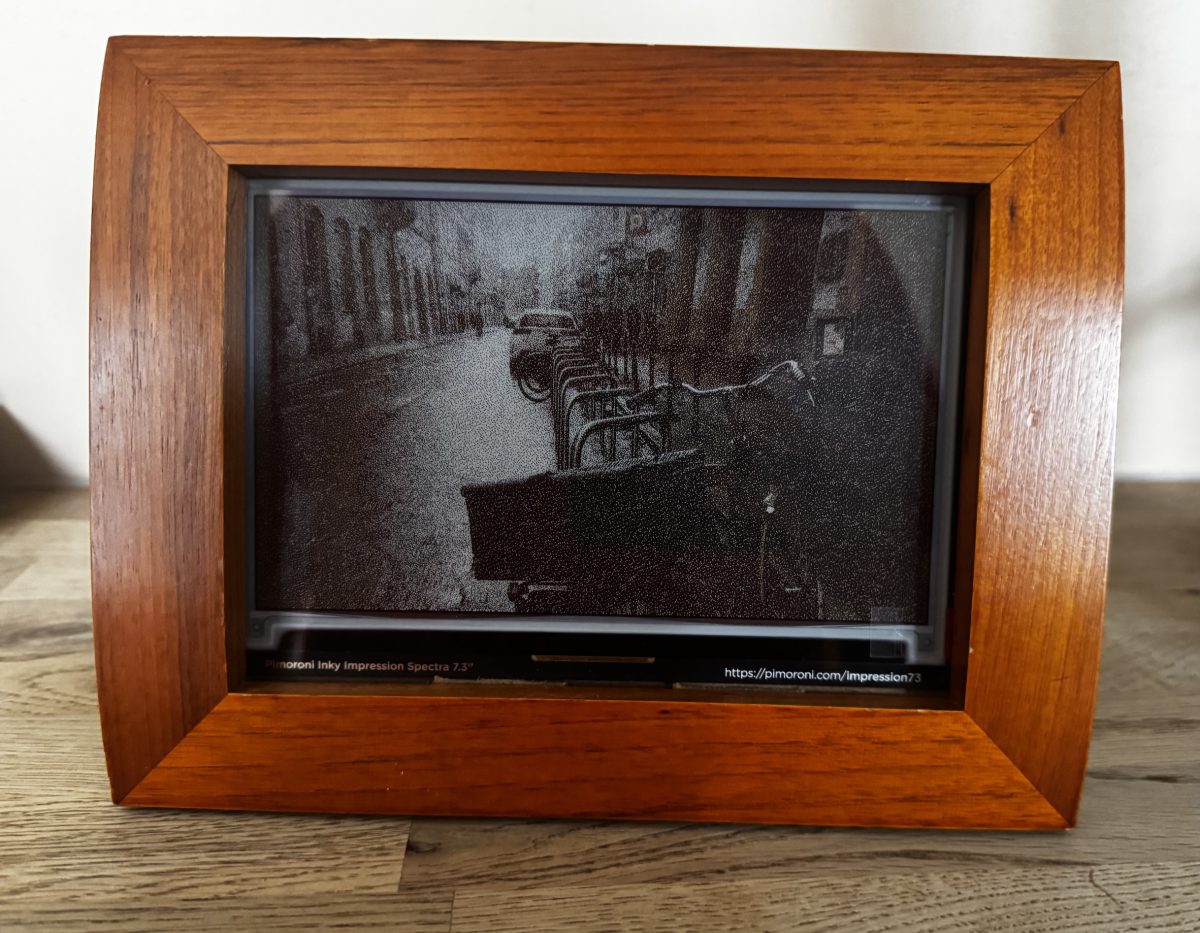
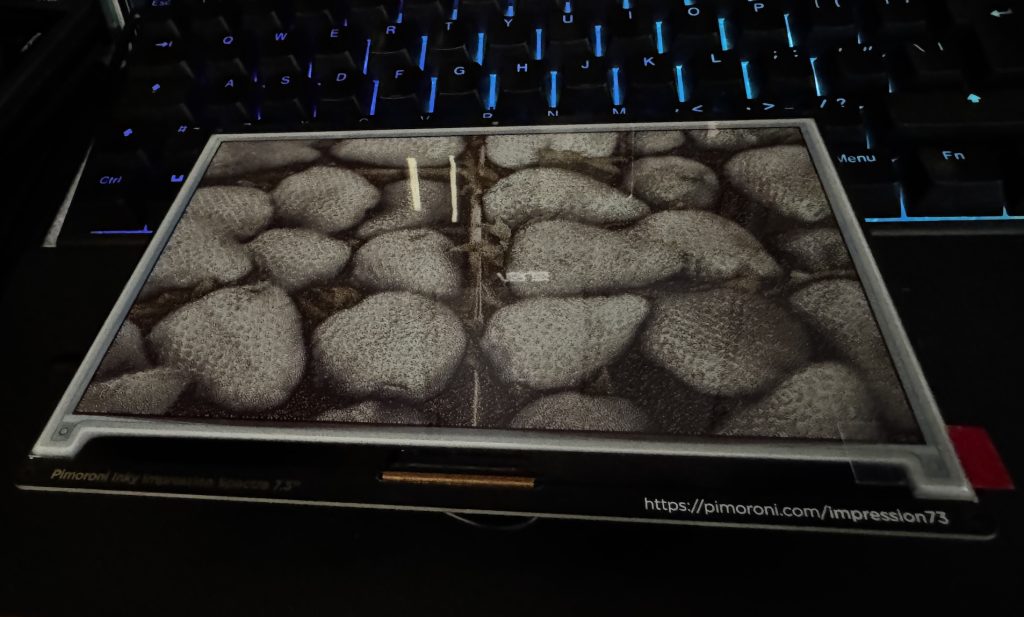
I’ve also been a long-time customer of Pimoroni and was aware of their range of nifty Inky displays. I recently came across this neat project by @mimireyburn and managed to pick up a 7.3″ Inky Impression after it being on back-order for only a week or two.
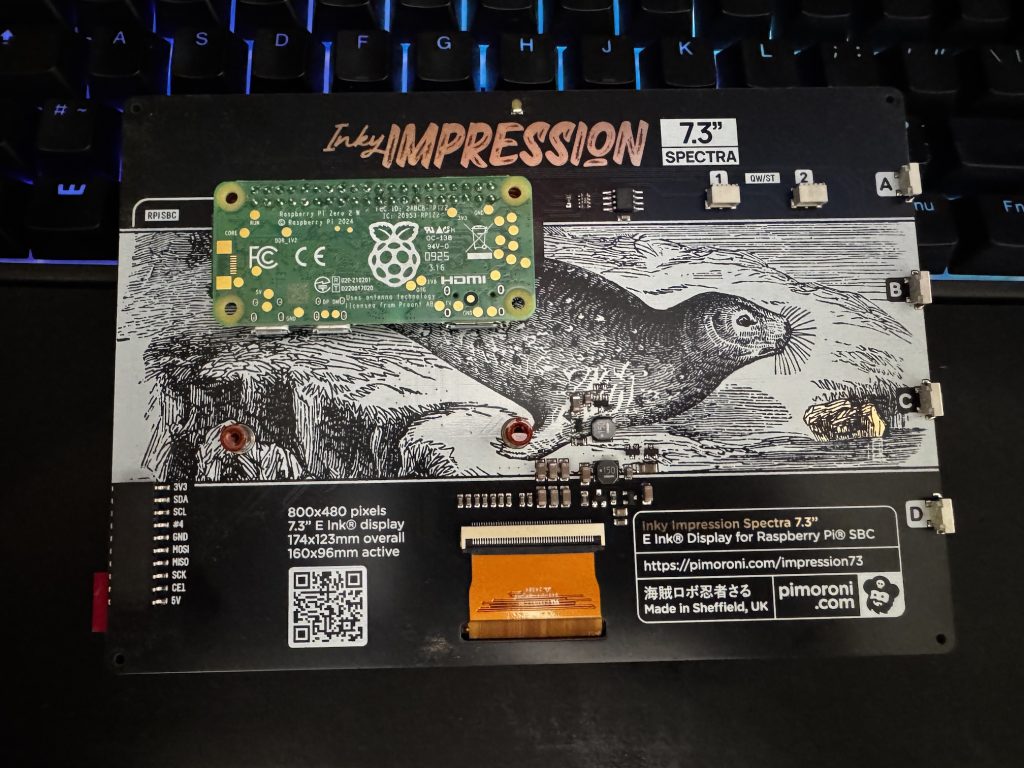
The Inky Impression 7.3″ with protective film and screen reflectionThe Inky Impression 7.3″ rear with mounted Raspberry Pi Zero 2W
After flashing RPi OS on a clean card for the Pi Zero 2W, downloading the project, setting up Python, compilers, virtualenvs, prerequisites, etc. I was presented with a complete failure of the underlying driver and inky library to communicate with the display. This isn’t a fault of the inky-calendar project at all, may I reiterate, but unfortunately a very regular occurrence I’ve found when using many Pimoroni products.
Searching around I tried a few different things, including the usual modifications to boot parameters to enable the drivers/kernel modules and fiddling with permissions, users etc. but with no success. Now I’ve never deliberately pretended to be a Python programmer, nor do I particularly wish to be one, but I’m pretty good with debugging weird stuff and this was definitely presenting as a driver/library issue. Specifically some of the differences with the Inky Impression 7.3 seemed to be tripping things up, and it wasn’t a hole I fancied spelunking in today.
A little more digging highlighted a NodeJS package by @aeroniemi with working Impression 7.3″ display support. I definitely have masqueraded as a JavaScript programmer in the past so things were looking up. Some light Claude.AI vibing and I had two working scripts – one to fetch images from PicSum and another to replicate the calendar fetching+rendering, both from public iCal and authenticated Google Cal sources – awesome!
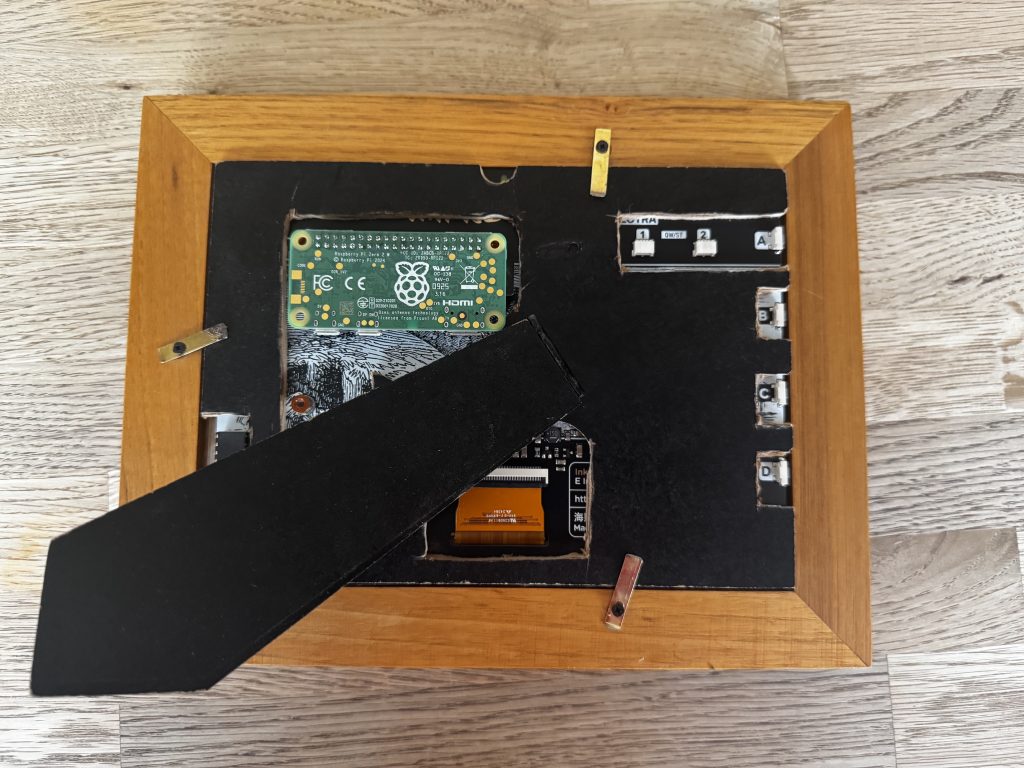
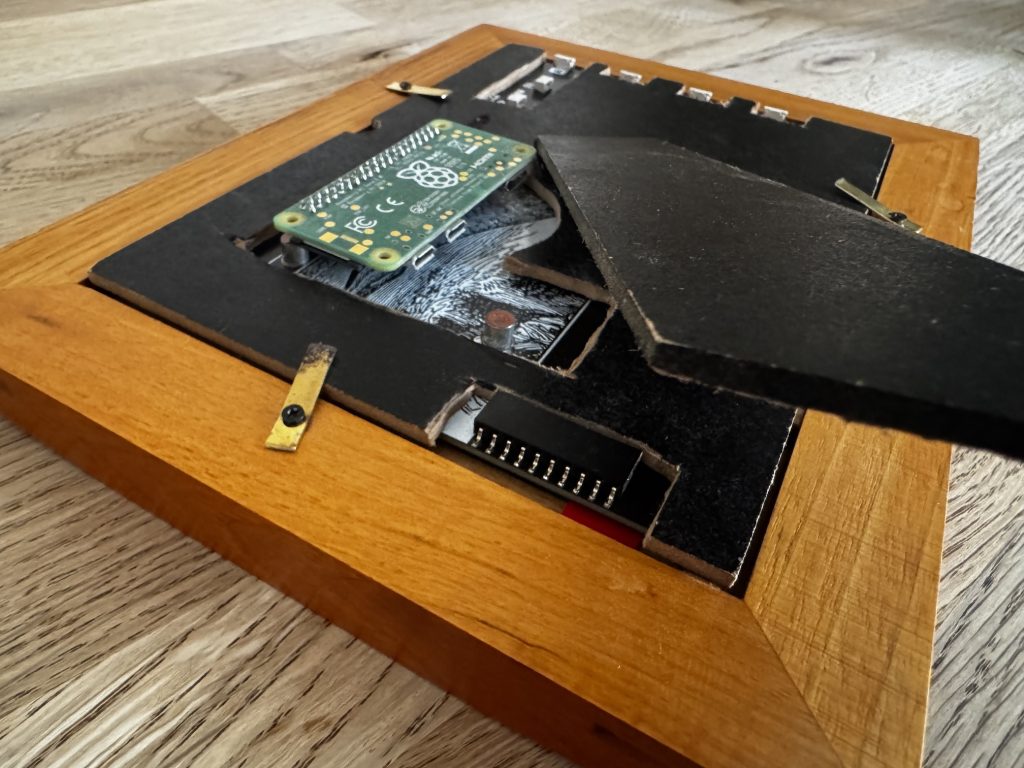
Some dremel butchery on the back panel of an old 7″ picture frame to fit around the sticky-out components on the back of the board and I was in business.
The rear of the photo frame with cut-outs for most of the components on the rear of the displayExtra clearance given to the left-most microUSB power socket on the Pi Zero 2W
Improvements
The only slight drawback with using this NodeJS library is that it only handles the image-display side of things – there’s no built-in support for the function buttons – something to revisit another day.
Another improvement would be to better-handle power – the main benefit of e-ink is that it doesn’t need power once the display has been set, and that’s not being utilised here at all – there’s a cronjob running on the Pi which displays the calendar before 10:00AM and photos after that, refreshing every half-hour.
*/30 6-10 * * * cd /home/frame/ ; node ical2png.js --calendar x --calendar y --google-calendar z --service-account KEY.json --view week ; node main.js --image calendar.png
*/30 10-23 * * * cd /home/frame/ ; node main.js --dither
Lastly, obviously, the display needs to load images from a folder rather than from the internet. That’s super-quick to do, and that’s this afternoon’s job. The calendar-rendering – fonts, sizes, colours etc. could do with a little more spit and polish too.
Sometimes you just have to plot more than one dataset on the same chart, but you might have a complex data table with some “collections” of single-values and some collections of multiple values. Here I’ve put together an example from something I’ve been working on recently. Once your back-end queries (SQL or whatever) are written and your templates convert those data into basic HTML tables, you can plot then straight to SVG/D3 without much extra work.
Nearly all of that extra work is around adding appropriate classes to cells to distinguish columns and collections of columns. The rest is to extract those cells out again and decide which should be plotted together.
In this example, tabs and table headings belong to classes “collection_#” “a_c#” where the collection_# identifies a set of columns to be displayed together and the a_c# identifies the (links for the) columns themselves. Collections with multiple columns therefore have a single collection class but contain more than one a_c# class.
Next each table tbody td data cell belongs to a c# class, one for each column. Each one is also uniquely identified by a td#_<date> which allows hovers on the table cell to highlight the SVG data point and vice versa. Next each cell contains a span with a “val” class (more on that in the next post).
SVG paths may now be built for each column. Clicks on table-headings and tabs are able to examine which columns co-display because they belong in the same collection and then scale and plot them appropriately.
Note that the first and last tabs in this example plot single lines to demonstrate mixed collections in action. The middle two tabs have two lines each but there’s no reason why you couldn’t have more (although there are only seven colours listed at the moment).
Recently I’ve been extending my “classic” JavaScript knowledge by learning NodeJS. I’m sad to say that writing cross-platform, Desktop-class applications in Perl is just way too much hassle. However, having also discovered node-webkit I’ve been able to accelerate my desktop application development using classic HTML & CSS knowledge and improving my JavaScript techniques, mostly trying to better understand fully asynchronous, non-blocking programming. Apart from some initial mind-bending scoping experiences which maybe I’ll come back to another day, it’s generally been a breeze.
One of the useful things I’ve been able to do is to automate cross-platform application builds for Windows and Mac (Linux to come, not a priority right now but should be easy – feel free to comment). It’s not compilation, but more like application packaging.
My project has the node-webkit distributable zips in “src/”. The target folder is “dist/” and I’m also using a few DOS tools (zip.exe & unzip.exe and the commandline Anolis Resource editor) which live in dist/tools. The targets are built with timestamped filenames, a .exe in “dist/win/” for Windows and a .dmg in “dist/mac/” for OSX. I don’t do anything clever with Info.plist on Mac though I know I should, but the icons are set on both platforms, assuming they’ve been pre-generated and saved in the right places (resources/).
On OSX I’m using system make which presumably came with XCode. On Windows I’m using gmake which on my system came with a previous installation of Strawberry Perl but is also available in a Windows binary/installer.
My Makefile looks something like below (“make” not being one of my strongest skills – apologies for the ugly stuff). It might not be 100% complete as it’s been excised out of the original, much more complicated Makefile, so use with caution. If anyone has any tips on stuffing it all into NSIS automatically as well, please comment.